
Every U.S. state will have a different mix of energy sources used to produce electricity. This energy mix depends on multiple factors, including the availability of natural resources in the state.
The United States produces and consumes many different types of energy sources, which can be grouped into general categories such as renewable and nonrenewable or primary and secondary. But what do those terms mean and how does that impact your electric bill or your carbon footprint?
Renewable vs Non-Renewable Energy Sources
The first classification that we will talk about is renewable versus non-renewable energy. As the name suggests, the difference in the two types of energy sources will be related to the limited supply.
Non-renewable energy comes from resources that are not replenished on a regular basis and therefore their supply on this earth is limited. Petroleum, for example, was formed millions of years ago from the remains of ancient sea plants and animals. It’s not possible to make more petroleum, at least not in a short period of time.
What are some non-renewable energy sources? You probably heard about coal, petroleum, natural gas, propane, and uranium. In the U.S., they are used to power our homes, move our cars, and for manufacturing various daily use products. They also account for the majority of the world’s greenhouse gas emissions.
Renewable energy comes from sources that replenish naturally day after day. The sun continues to shine, the wind continues to blow and the water continues to run – and with the use of technology, we can continue to harvest energy from these sources indefinitely at no additional cost. Biomass, geothermal energy, hydropower, solar energy, and wind energy are all considered to be renewable energies.
Unlike coal or petroleum, generating energy from renewable sources – often referred to as green energy – doesn’t result in harmful greenhouse emissions being produced.
But it’s not just emissions we should be concerned about. According to research, electricity-generating facilities are also the single biggest consumers of fresh-water in the U.S. Why should that concern us? You might be aware that the world is currently in a water crisis, with several major cities across the globe are already counting the days towards the “Day Zero,” when they’ll officially run out of water.
Which energy resources are gulping down our water?
Let’s look at the water consumption in gallons per MWh produced by energy source:

For an example of the impact of extensive water consumption resulting from overreliance on non-renewable sources, you need to go no further than Texas. The Lone Star State has been battling a water deficit for years, while according to research, 100 percent of the water deficit projected for five counties in 2020 can be met by cutting oil and gas water use by half.
Primary vs Secondary Energy Sources
The other energy source distinction we can make is between primary and secondary sources. Primary energy sources are unconverted fuels, meaning that they continue in the form that they were found in nature, before being converted into secondary or tertiary forms of energy.
We are, of course, talking about petroleum, natural gas, coal, biomass, flowing water, wind, and solar radiation.
Secondary sources of energy—converted from primary energy sources—are used to deliver energy in an easily usable form. For example, petrol is derived from the treatment of crude oil, and electricity is obtained from either coil or in the more environmentally-friendly case, solar radiation
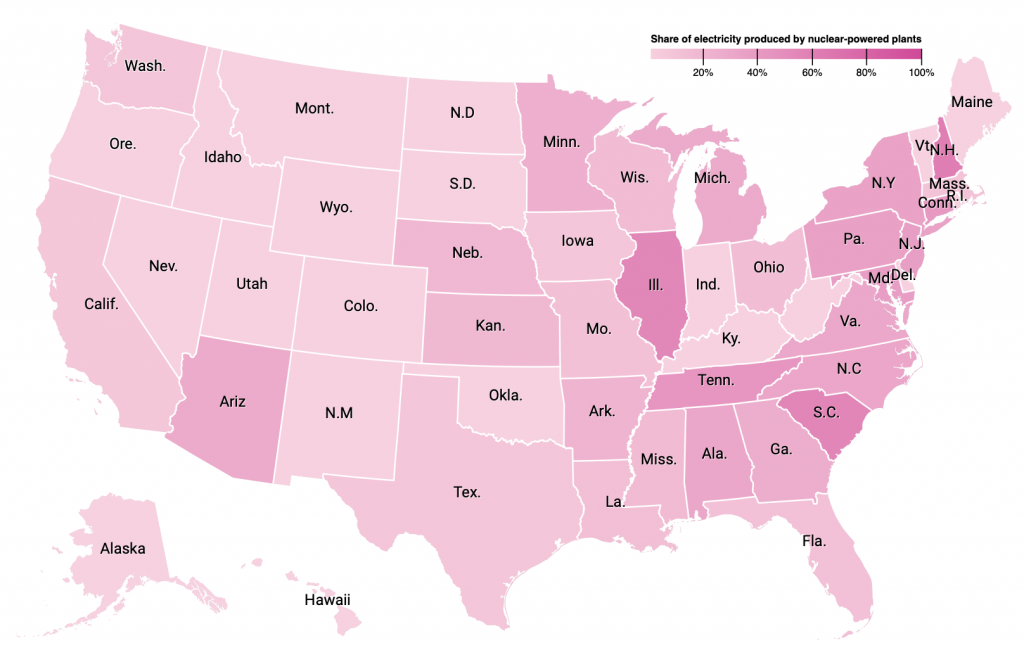
How Does Your State Make Electricity?
Every U.S. state will have a different mix of energy sources used to produce electricity. This energy mix depends on multiple factors, including the availability of natural resources in the state.
For example, 26% of the coal produced in the United States came from the Appalachian coal region, including Wyoming, West Virginia, Pennsylvania, Kentucky, and Illinois.On the other hand, warm sunny states, such as California, Nevada, or Hawaii will have higher portions of solar-generated electricity.
Let’s compare the electricity mix by energy source in each U.S. state:
Please click on the map above to read the rest of the story and see how your state is doing via the cool interactive map! Our thanks to ElectricRate for sharing this with our readers!
Join the conversation!