Another core aspect regarding gun violence statistics is the comparison between firearms and violent crimes.
If guns were more regulated, would crime rates go up, down, or stagnate? We can review several years’ worth of gun violence statistics, ownership, and crime trends between states and countries to better understand the impacts of guns on crime.
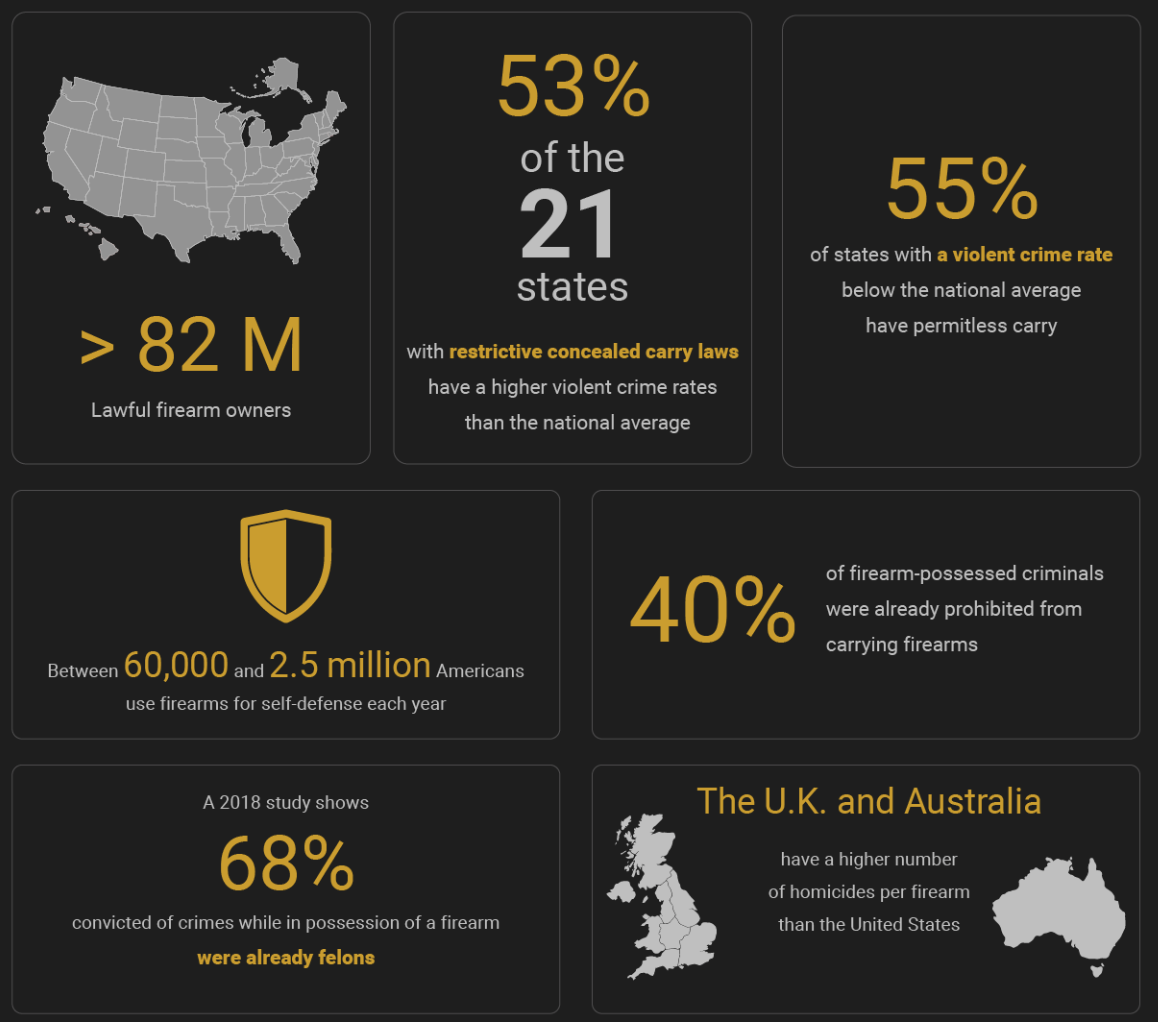
Report Highlights:
- The U.S. has more than 82 million lawful firearm owners.
- 53% of the 21 states with restrictive concealed carry laws have violent crime rates higher than the national average.
- 55% of states with a violent crime rate below the national average have permitless carry.
- Between 60,000 and 2.5 million Americans use firearms for self-defense each year.
- 40% of criminals convicted of crimes while in possession of a firearm were already prohibited from carrying firearms.
- A 2018 study shows that 68% of those convicted of crimes while in possession of a firearm were already felons.
- The U.K. and Australia have a higher number of homicides per firearm than the United States.
Gun Violence and Legal Gun Owner Statistics
- There are more than 82,000,000 legal gun owners in America.
- In 2022, Wyoming had the least firearm-related homicides (17) and more firearms per person than any other state.
- It is currently estimated that more than 2.5 million Americans use firearms for self-defense each year.
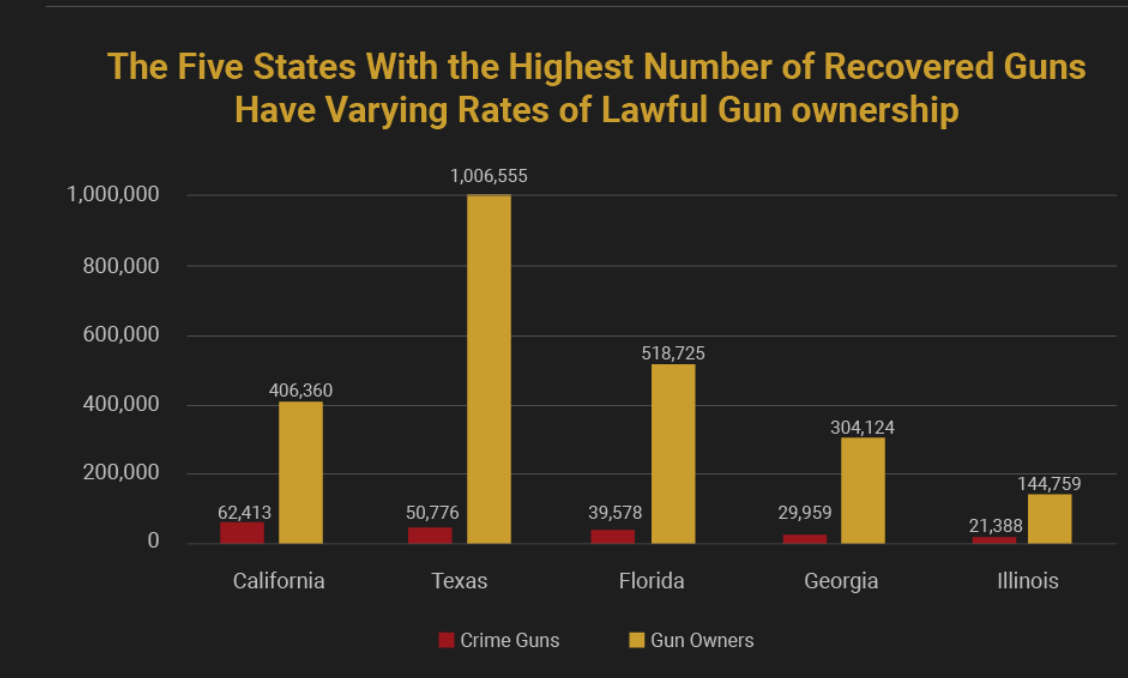
- States with the highest number of crime guns recovered have varying rates of ownership, meaning that lawful firearm ownership has no correlation to firearm-related crimes.
- The number of American citizens who support strict gun control has declined since 1992 (56% in 2023 versus 78% in 1990).
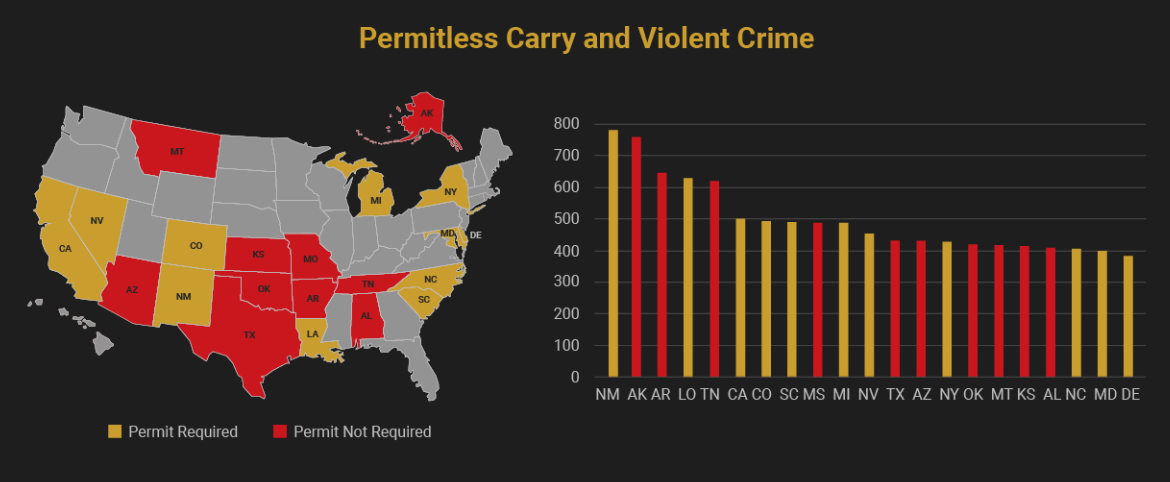
- Of the 28 states with permitless carry, only 10 have violent crimes above the national average.
Lawful Gun Ownership and Crime
States with the highest rates of gun ownership have the fewest gun crimes per the ATF eTrace. However, states with large population sizes have higher rates of guns used in crimes (recovered).
Unlawful Possession and Gun Violence
Criminals, Guns, and Crime
Gun violence statistics vary by state due to different state laws. In the 13 least restrictive gun states (2008), ⅔ of criminals convicted of a crime where a firearm was involved weren’t stopped by existing laws and wouldn’t have been stopped by stricter legislation.
- 31% would not have been prohibited from firearm possession if gun laws were stricter
- 40% were already prohibited
- 28.9% would have been prohibited if gun laws were stricter
Note: These calculations do not include the age of the offender at the time of arrest, and therefore, the number of prohibited persons may be higher.
A 2018 study performed on inmates in Illinois shows that 74% of re-offenders were convicted of a second firearm-related crime within 10 years.
- 68% of felons used illegal guns
- 67% of murderers had a prior arrest record
- 21% of murderers had multiple prior arrests
- 2.3% of 7,632,470 arrests in 2020 involved weapons
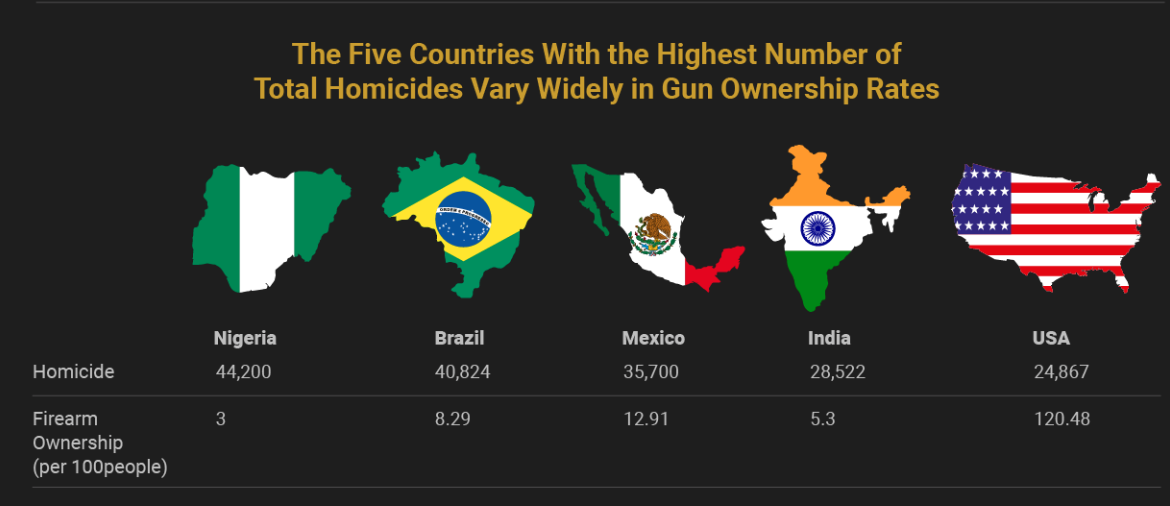
Gun Violence Rates by Country
Many gun control proponents state that other countries do not have as many homicides as the United States. However, we can see that gun ownership does not correlate with homicide rates.
Do More Guns Equal More Homicides?
If more guns equal more homicides, then it would stand to reason that there would be more homicides per firearm. However, this isn’t the case.
While it’s true that the U.S. has more firearms and a higher homicide rate than the U.K. and Australia, the rate of homicides per firearm in the U.K. and Australia is actually much higher.
The UK vs. US crime rates
It’s important to consider gun violence statistics among various countries. The UK has 615,627 firearms with 673 total homicides, as opposed to the United States, 500,000,000 with 24,867 total homicides. There are .21 homicides per firearm in the U.K. compared to only 0.004 homicides per firearm in the U.S.
Furthermore, Americans have access to 20,107 firearms per homicide. Those in the U.K. have access to only 915 firearms per homicide.
Therefore, more firearm access does not increase homicides.
Australia vs. the U.S. crime rates
Australia has 3,500,000 firearms, with only 221 homicides in 2021. The U.S. had 500,000,000 firearms, with 24,867 firearms in 2022. There are 0.006 homicides per firearm in Australia and only 0.004 homicides per firearm in the U.S.
Furthermore, Americans have access to 20,107 firearms per homicide, and Australians have access to 15,837 firearms.
The number of accessible firearms does not increase the number of homicides.
Do Violent Crimes Increase with Firearm Access?
Another core aspect regarding gun violence statistics is the comparison between firearms and violent crimes. As many would suggest, firearms increase violent crimes. Let’s compare.
The U.K. vs. U.S.
The U.S. had 2,486,144 reported violent crimes in 2022 and 2023. The U.K. had 4,210,952 during that same time period.
With 1/10 of the firearms in the U.S., the U.K. had twice as many violent crimes.
Several police precincts failed to report gun-related crimes in 2020, 2021, and 2022. Therefore, we don’t know exactly how many crimes involved firearms.
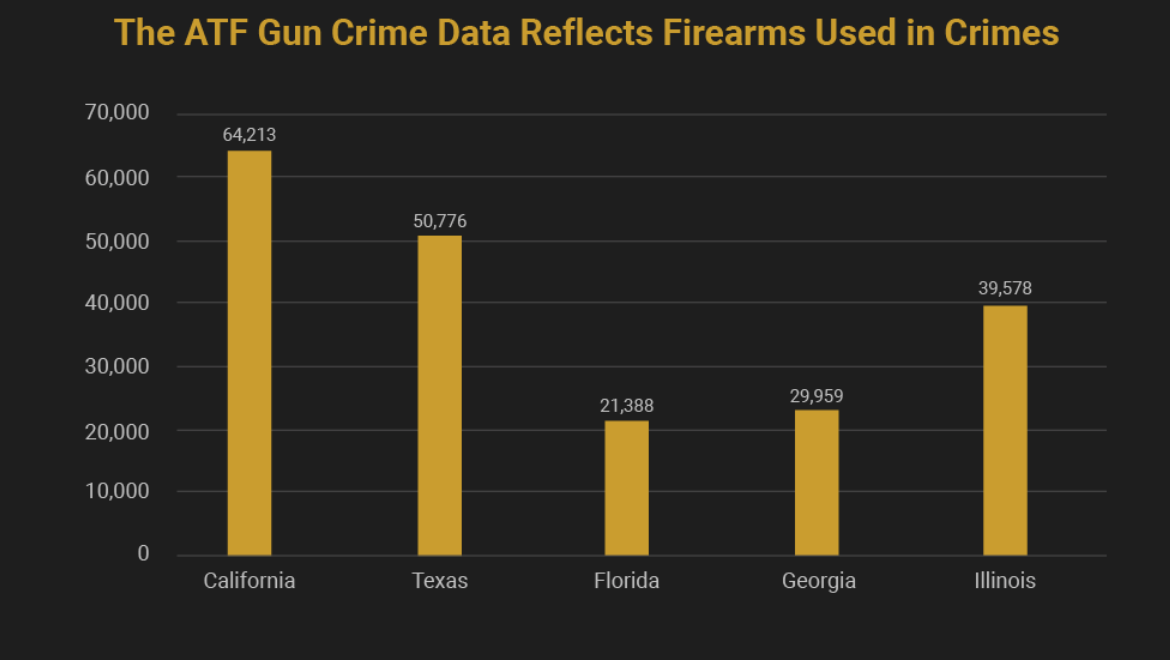
However, we can look at the ATF crime gun data for 2021 to better understand which states have higher gun crimes.
Does Concealed Carry Reduce Gun Violence?
There are 21 states with violent crime rates higher than the national average (380.7). Of those states, 53% restrict concealed carry with permits and registrations.
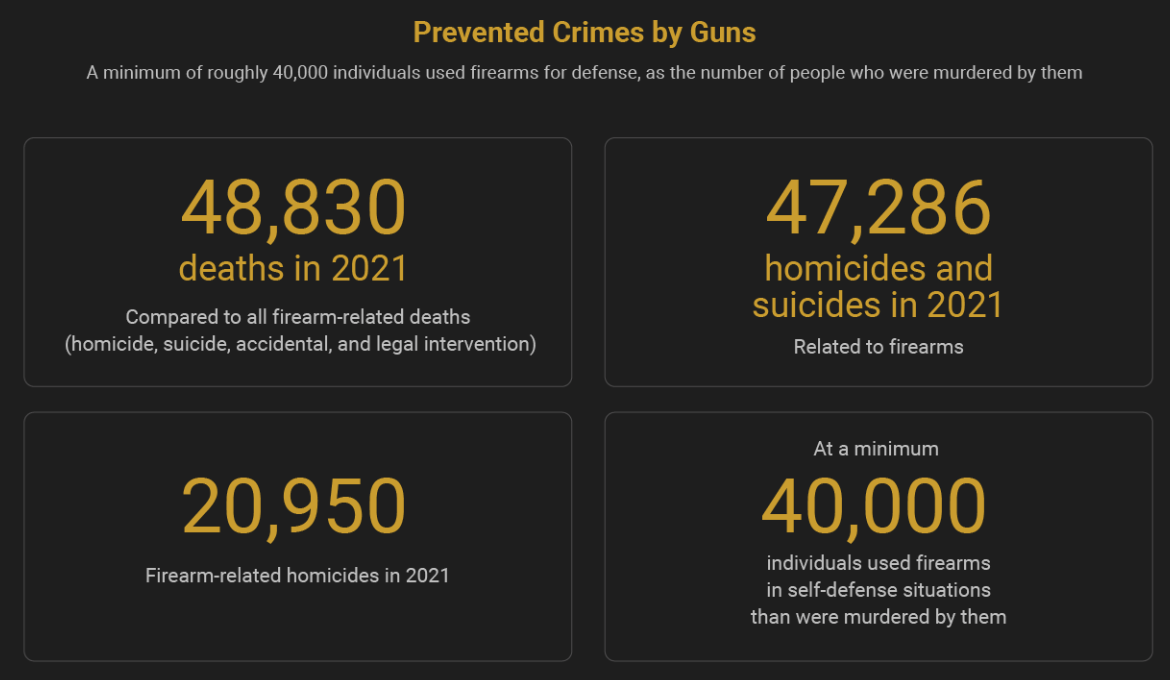
How Many Crimes Are Prevented by Guns
Previously removed reports from the CDC stated that there are somewhere between 60,000 and 2.5 million defensive use cases of firearms in the U.S. each year.
- Compared to all firearm-related deaths (homicide, suicide, accidental, and legal intervention), there were 48,830 deaths in 2021.
- There were 47,286 homicides and suicides related to firearms in 2021.
- There were 20,950 firearm-related homicides in 2021.
- At a minimum, 40,000 more individuals used firearms in self-defense situations than were murdered by them.
LegalReader thanks our friends at Ammo.com for permission to share this report. The original is found here.
Sources:
- Defensive Use Study
- Prior Offenses
- Arrest Stats 2020
- ATF Crime Guns 2017-2021
- Gun Sales
- Prisoners and Gun-Related Crimes
- Illinois Gun Crime Recidivism
- Homicides in India 2022
- Homicides Brazil 2022
- Homicides in Russia 2021
- Firearm ownership Nigeria
- Violent Crimes UK
- CDC Deleted Defensive Use Study
- Permitless Carry States
Join the conversation!