
If one of your daily crossings is on the list, you now know something the driver next to you probably does not. Drive like it.
Run a personal injury firm in Texas long enough, and the intake calls start to rhyme. The same frontage roads. The same unprotected left turns. The same handful of crossings, coming up again and again in crash reports, until the paralegals can guess the intersection before the caller names it.
For years, our firm treated that pattern the way every firm does: as background knowledge, useful for the case at hand and nothing more. We would pull the TxDOT crash records for one intersection, for one client, prove what we needed to prove, and move on. Then, at some point, we asked the obvious question. If the state already records every crash at every crossing, and if we keep pulling the same locations over and over, why doesn’t any driver in Texas know which intersections those are?
The scale of the answer surprised even us. Texas drivers were involved in 617,930 reported crashes in 2025. Roughly one in four happened at an intersection. That is more than 400 intersection wrecks every single day, and the state has known exactly where they occur, down to the specific crossing, the whole time.
The data was public. It just wasn’t usable.
TxDOT’s Crash Records Information System (CRIS) publishes a public extract of every reportable crash in the state. We had worked with it for years, one crash at a time. Taken whole, it is an enormous dataset, millions of rows deep, spread across dozens of fields and files. A transportation researcher with database skills could work with it. A parent trying to figure out whether the route to their kid’s school runs through a crash hotspot could not.
That gap between public data and public knowledge used to be permanent, because closing it required a data team that a firm our size could never justify. Cleaning records, geocoding crash locations, clustering thousands of coordinates to specific crossings: that was weeks of specialist work. AI-assisted analysis collapsed it into days. We are trial lawyers, not a data company, and we still got it done in-house.
The result is a free, interactive map of the 50 most dangerous intersections in Texas, ranked solely by the number of crashes TxDOT recorded at each in 2025, with the methodology and sources published alongside it, so anyone can check our math against the same extract we started from.
What the map taught us
We expected our own backyard to top the list. It didn’t. The number one spot belongs to Temple, a city of about 90,000, where General Bruce Drive meets the H K Dodgen Loop: 77 crashes in one year, more than one per week, with 39 injuries. Second is the Central Expressway at University Drive in McKinney, with 58 crashes and 45 injuries. Round Rock, Beaumont, Manvel, and Corpus Christi all crack the top ten before Houston makes its first appearance.
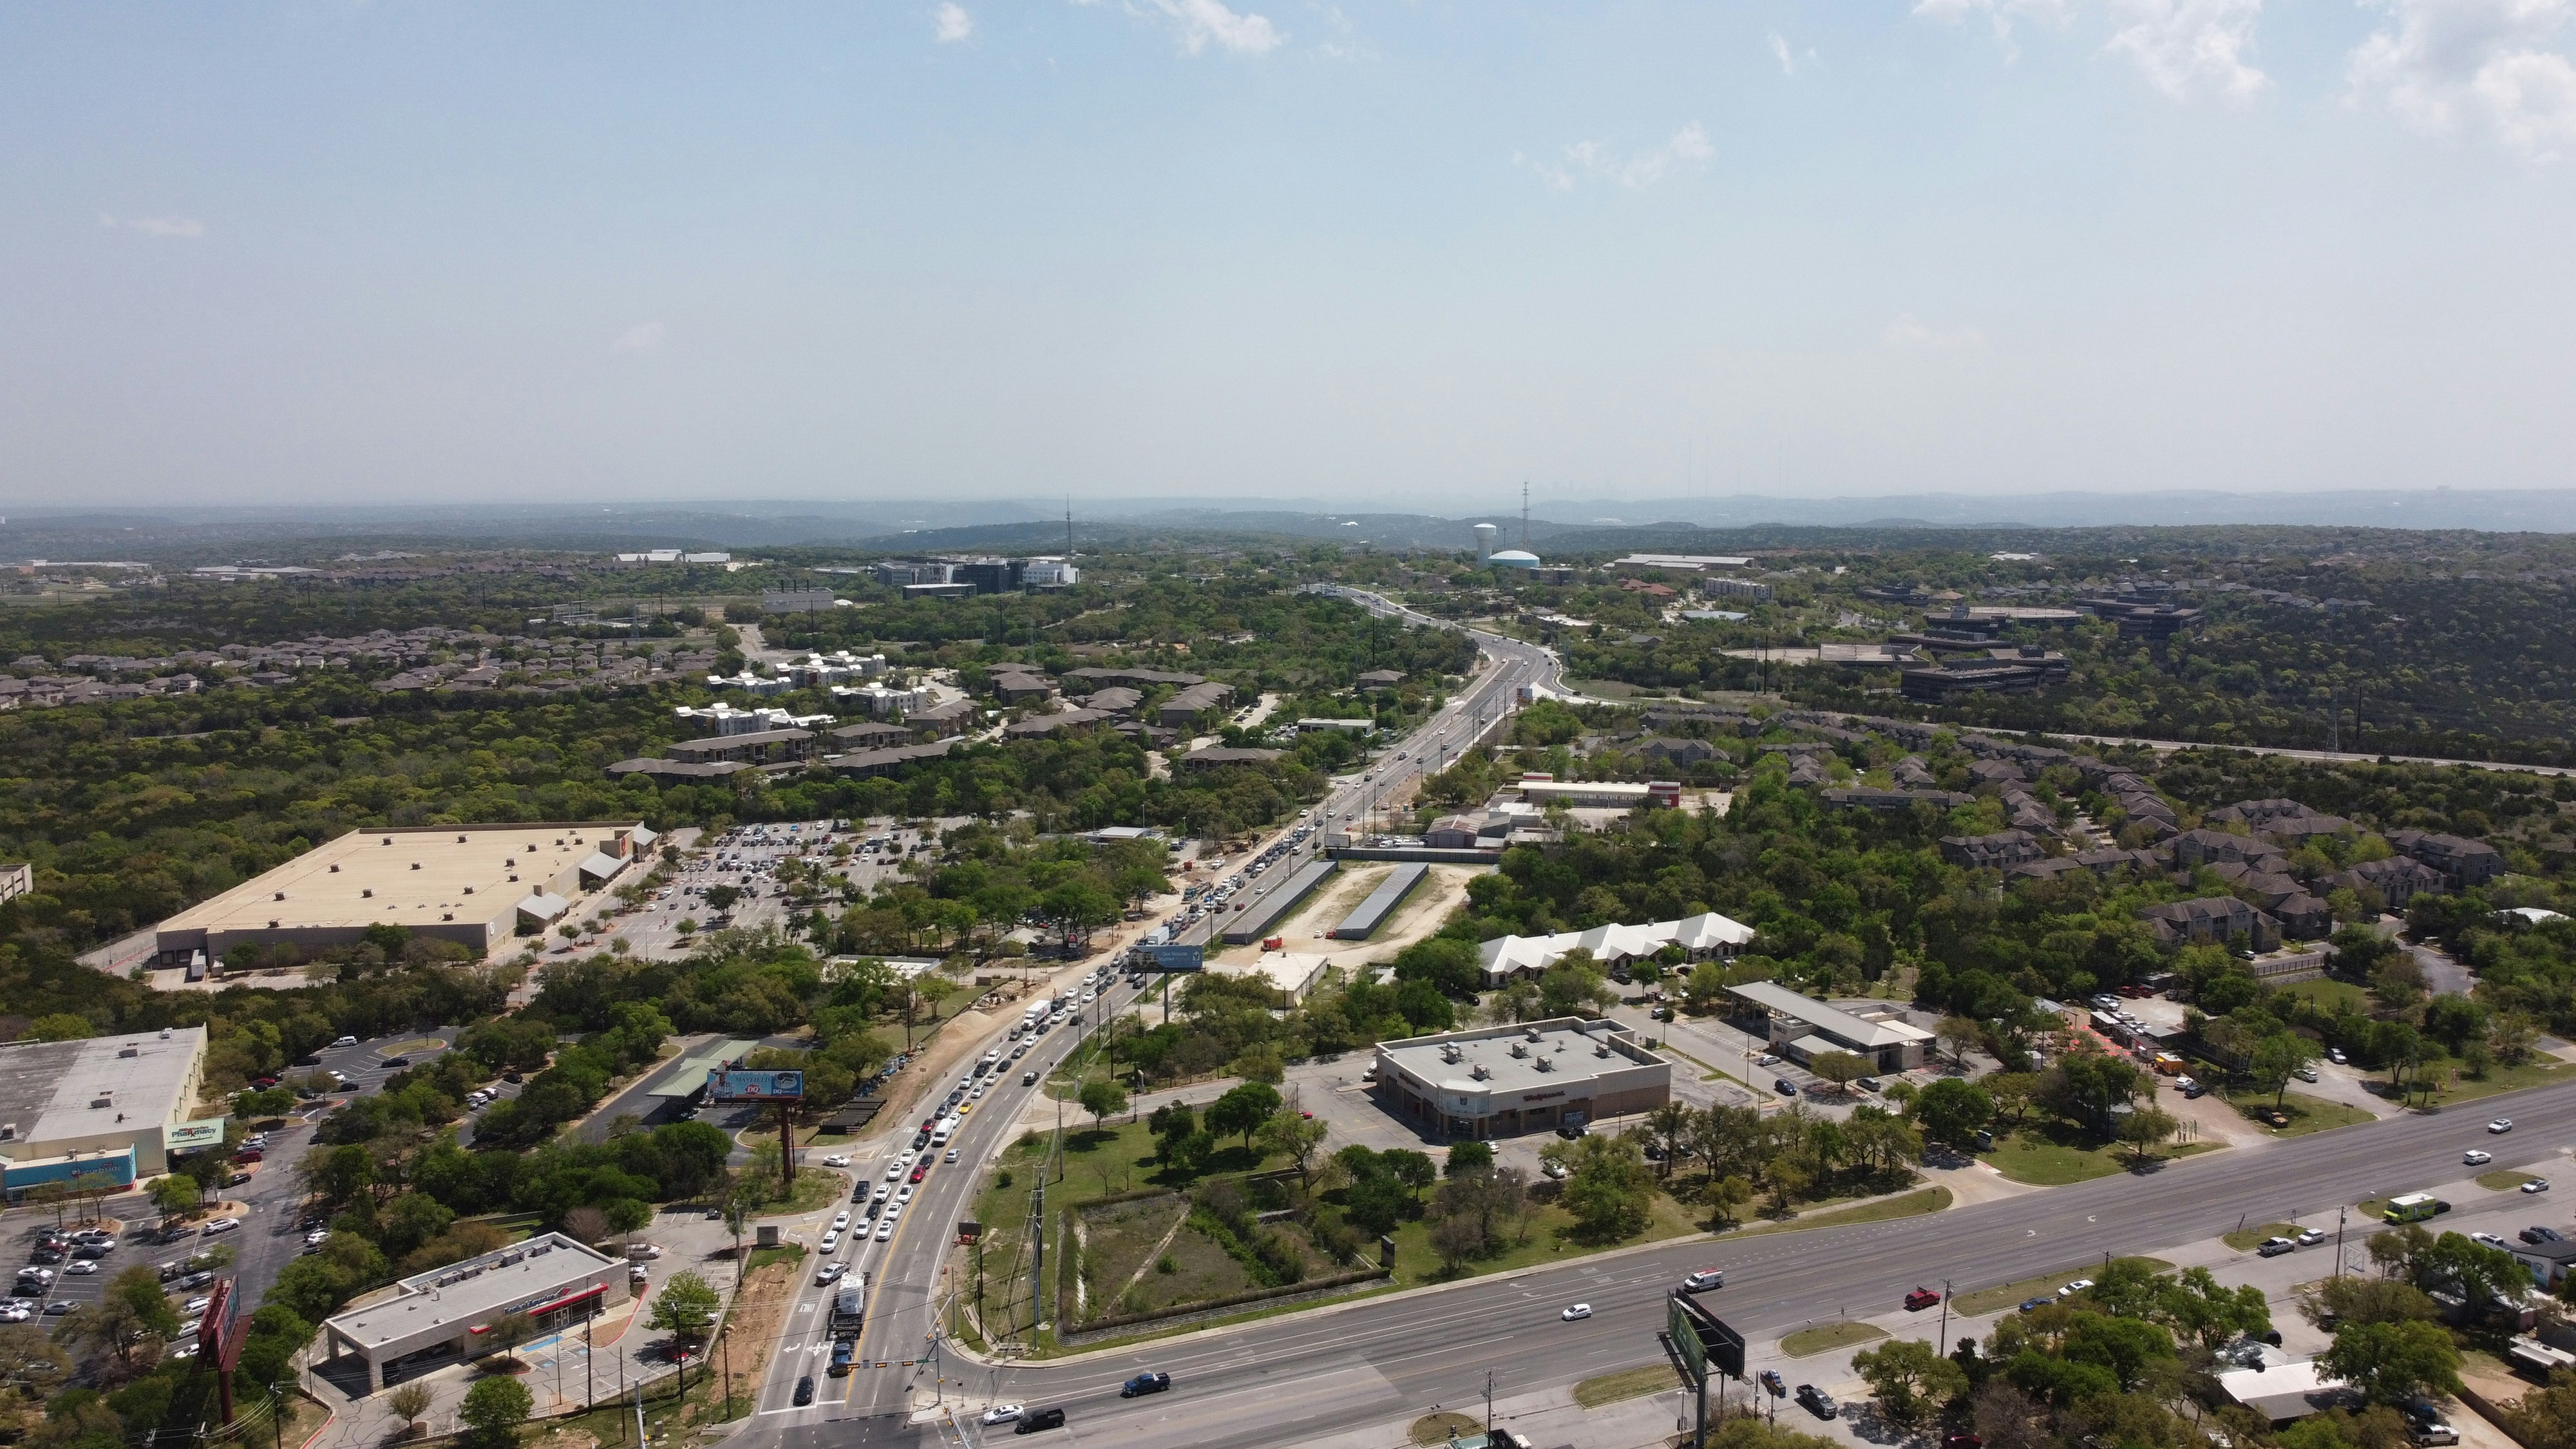
The pattern underneath matched what our case files had been whispering all along: what predicts crashes is not city size but road type. The deadliest crossings are rarely downtown grids, where traffic is heavy but slow. They are high-speed suburban arterials, frontage roads meeting major surface streets, and interchange feeders where drivers merge, exit, and turn across several lanes at 50 miles per hour. Dallas Parkway at Frankford Road shows why these wrecks fill our caseload: 35 crashes there in 2025 resulted in 37 injuries, more injuries than crashes, because multi-lane, high-speed collisions tend to injure more than one person at a time.
The federal numbers told us Texas is no outlier. The Federal Highway Administration attributes roughly one quarter of traffic fatalities and about half of all traffic injuries in the United States to intersections. And the National Highway Traffic Safety Administration’s crash causation survey attributed about 96 percent of intersection crashes to driver error, with the single largest factor, at 44 percent, being what researchers call inadequate surveillance. The driver looked but did not see. That finding matched our files, too: the T-bone from a red-light run, the left-turn across traffic that had the right of way, the rear-end crash from following too close at a signal. Every one of them is a driver decision.
Why does a law firm give this away
Because the driver’s decision is the whole game, a map like this can actually help. Drivers will know a specific crossing on their commute ranks among the worst in the state and will treat it differently. They leave more following distance and are more attentive while driving.
Parents of newly licensed teenagers can review the family’s regular routes and discuss the specific hazards at the crossings their kids actually use. Fleet managers can route around the worst clusters or flag them in training.
None of that requires a lawyer, a subscription, or any technical skill. That is the point. Our firm sees these collisions after they happen, when someone is already hurt. A tool that keeps even a fraction of drivers out of our intake queue is the best outcome our data could produce.
What the map cannot do is our day job
A crash count answers where. It says nothing about who, and who is what a claim turns on. Texas follows modified comparative fault under Texas Civil Practice and Remedies Code section 33.001: found more than 50 percent responsible, you recover nothing, and any lesser share of blame reduces your recovery in proportion. Adjusters know the map cuts both ways; a notorious crossing becomes their argument that everyone, including you, should have been driving more cautiously there.
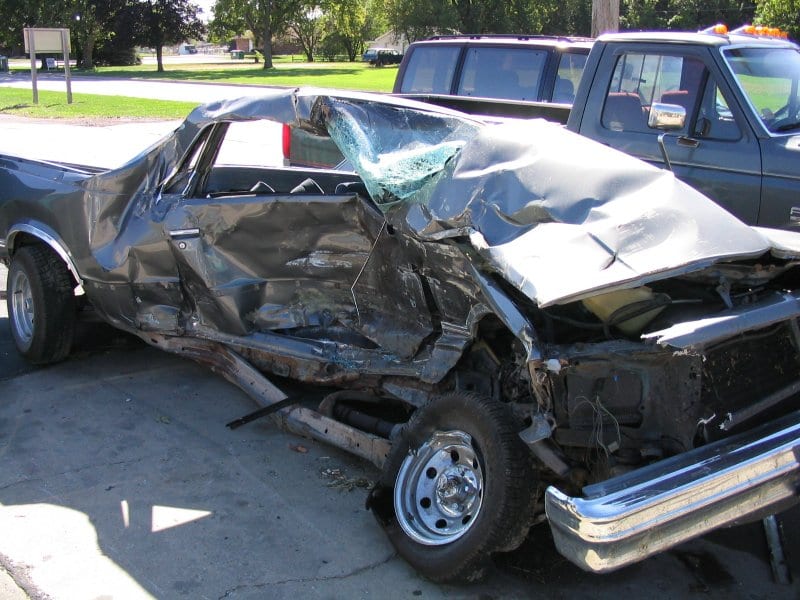
Fault still comes down to the moment of impact: who ran the light, who missed the yield, what the camera footage and witness statements show. That evidence decays fast, cameras overwrite on a loop, and witnesses scatter, while section 16.003 gives you two years to file, and claims against a city or the state demand written notice measured in months, sometimes as short as 45 days. So we tell everyone who’s been hurt at one of these crossings the same thing: treat the map as context, not a conclusion. Call 911 so a crash report exists, photograph the scene before anything moves, see a doctor the same day, and only then talk to an adjuster. Our Dallas car accident lawyers spend much of their time reconstructing exactly these intersection collisions, and the case usually turns on evidence gathered in the first days, not on the location’s reputation.
Where this goes next, for us and for other firms
The intersection map turned out to be the first use case, not the last. The same approach, AI plus public data plus the domain knowledge a firm already has, produced our free Texas crash report decoder, which translates the codes on a TxDOT crash report into plain language, and a calculator that untangles Uber and Lyft insurance coverage tiers. Each one started the same way the map did: with a question our clients kept asking.
Every practice area sits on a version of this opportunity. Nursing home firms know which inspection records matter; premises firms know which code violations precede injuries; workplace injury firms know how to read OSHA data. State agencies hold decades of safety records that citizens technically own but practically cannot read, and law firms are the rare institutions that hold both the expertise to interpret that data and a reason to publish it. AI just removed the last excuse, which was cost.
That, to us, is the real story of AI and safety working together: not replacing the lawyer, but letting a firm’s accumulated knowledge protect people before they ever need one. In the meantime, the homework for Texans is simple. Pull up the rankings and find the roads you actually drive. If one of your daily crossings is on the list, you now know something the driver next to you probably does not. Drive like it.
Join the conversation!