In 2019, fatally injured vehicle occupants were approximately 50% less likely to have been wearing a restraining device when compared to the national average rate of use.
The number and types of motor vehicle accident deaths differ quite significantly between America’s 50 states and the District of Columbia. The population of a state clearly impacts the number of vehicle accident fatalities, but many other factors also play a part; these include travel speeds, state traffic laws, the types of vehicles most popularly driven, weather, topography, and the standard of emergency care available in the state.
It takes time to collate the most up-to-date figures regarding road accident statistics. The latest facts and figures from the U.S. Department of Transportation’s Fatality Analysis Reporting System (FARS) cover statistics from 2019. Here are some interesting interpretational analyses of those published facts and how they differ from state to state.
Fatal crash totals
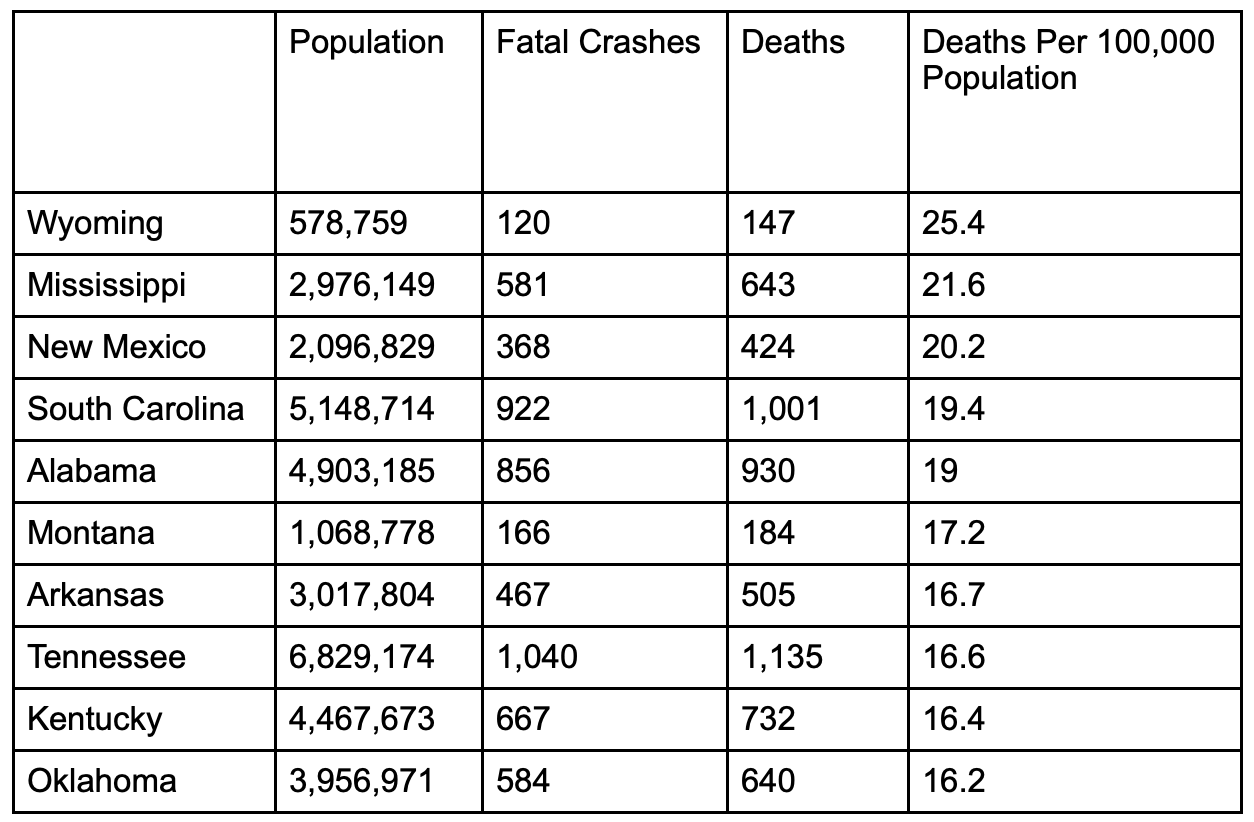
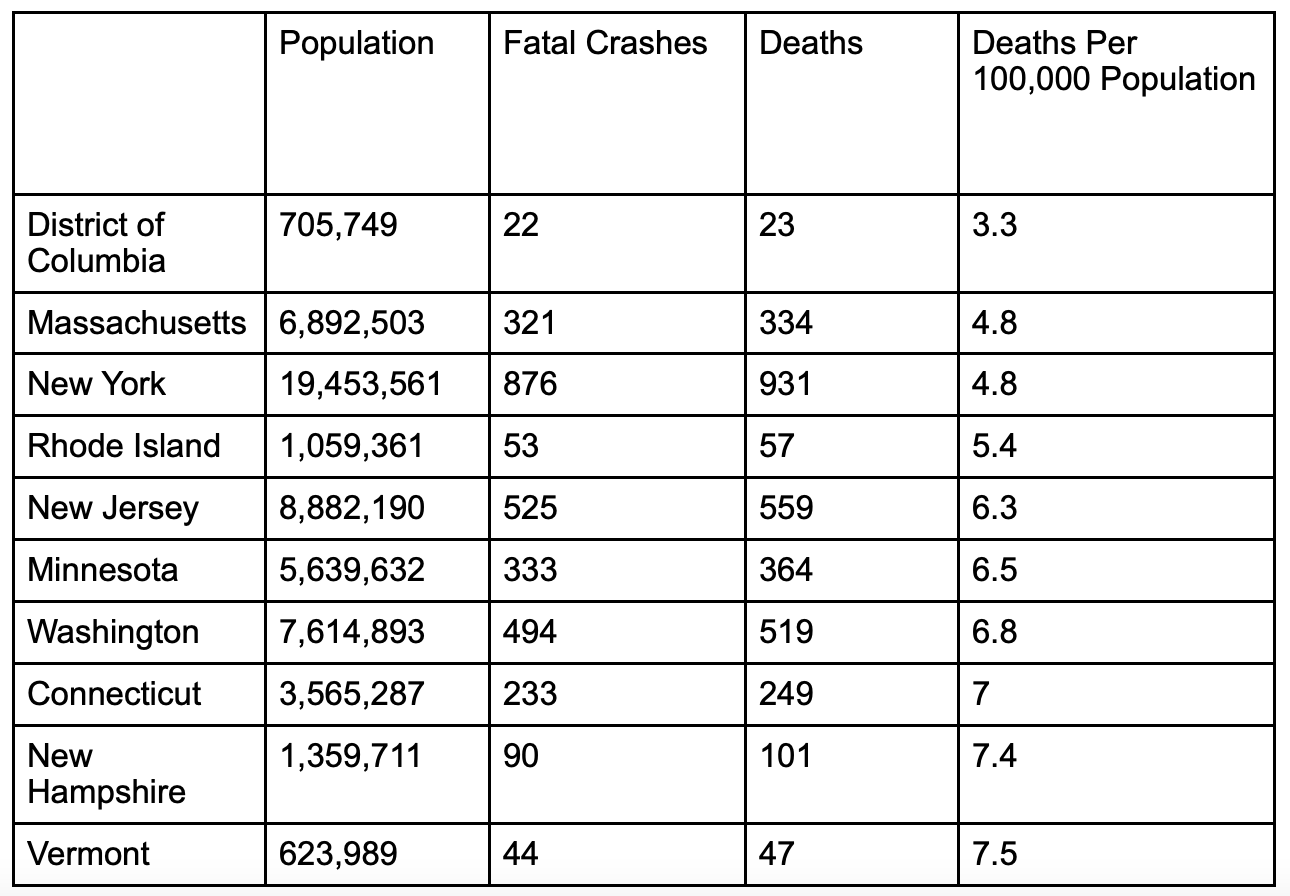
In 2019, a total of 33,244 fatal motor vehicle accidents occurred across the U.S., resulting in 36,096 deaths. The average number of deaths per 100,000 was 11, but ranged significantly between states. The lowest fatality rate per 100,00 people was 3.3 in the District of Columbia, while the highest occurred in Wyoming at 25.4.
Top ten states for highest Deaths Per 100,000 Population
Top ten states for lowest Deaths Per 100,000 Population
Alcohol-related car accident fatalities
Blood alcohol concentration (BAC) for passenger vehicle drivers is not always reported by some states, so to gain as accurate an overview as possible, some BAC information is estimated by the U.S. Department of Transportation using their multiple imputation model.
The legal alcohol limit also differs state to state. In Georgia, for example, one local Atlanta car accident lawyer reports that a driver with a blood-alcohol level of .08 or higher is generally considered to be negligent as a matter of law.
Overall for 2019, BAC was reported in 65% of driver fatalities. From these statistics, North Dakota was estimated to have the highest percentage of driver deaths with BACs of 0.08% or over at 41%, with Rhode Island following closely behind with an estimated 39% of fatal drunk driving accidents. Meanwhile, West Virginia and Utah were estimated at the lowest of 14%.
The only other states to come in below 25% were Kentucky (21%), Minnesota (22%), New Jersey (24%), and Oklahoma (24%).
Motor vehicle accident fatalities by road user type
The types of motor vehicle accident deaths varied across the states in 2019. Vermont recorded the highest percentage of fatalities involving car occupants (45%), while the state’s SUV and pickup-related deaths remained relatively low at 21%. Conversely, Alaska recorded the highest percentage of SUV and pickup-related fatalities (48%), yet a relatively low percentage of car occupancy deaths (24%).
Hawaii suffered relatively low fatalities for both car and SUV/pickup occupants (19% and 23% respectively), yet reported a relatively high percentage of pedestrian fatalities (33%). The District of Columbia had the highest percentage of pedestrian deaths at 39%, while Florida, New York, and Delaware tied for the highest percentage of crash fatalities involving bicyclists (5%).
Single v multi-vehicle crashes
Across America in 2019, almost exactly half (53%) of all motor vehicle crash fatalities were single-vehicle crashes. The highest percentage of deaths from single-vehicle accidents was in Maine (68%), while the highest percentage of multiple-vehicle deaths was in Nebraska (57%).
Restraint use

According to surveys conducted state-by-state, 91% of front-seat passengers used a seat belt in 2019. Hawaii recorded the highest rate of use (97%), while New Hampshire came in the lowest at 71%.
In 2019, fatally injured vehicle occupants were approximately 50% less likely to have been wearing a restraining device when compared to the national average rate of use. Among each state’s fatally injured occupants, Delaware recorded the highest restraint use (61%), while Massachusetts reported 30%, the lowest use of restraints among fatally injured occupants nationwide.
Final thoughts
For a deeper dive into all state-by-state statistics, you can visit the National Highway Traffic Safety Administration. The next published statistics may interestingly show significant changes given the conditions of the pandemic and subsequent lockdowns, yet it remains to be seen whether state-specific trends in data will alter.
Join the conversation!